GU – Adrenal

  • Update on CT and MRI of Adrenal Nodules Key Points

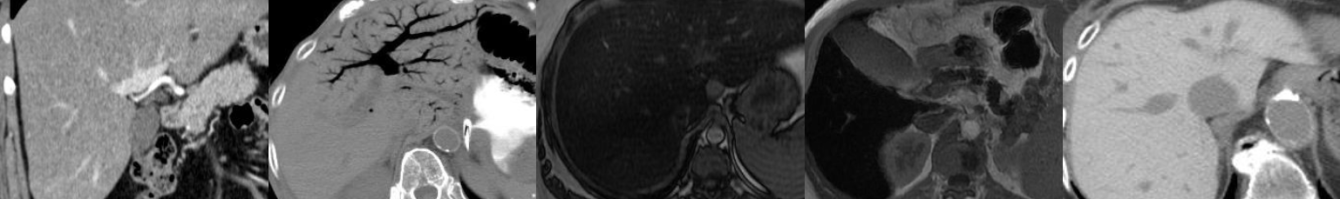
    “For example, approximately one-third of pheochromocytomas will show washout in the adenoma range, and adenomas can enhance avidly on the 70-second phase of enhancement [52–55]. Therefore, pheochromocytomas cannot be reliably differentiated from adenomas using CT washout protocols [52–55] (Fig. 7). The presence of intracytoplasmic lipid effectively excludes the diagnosis of pheochromocytoma [55] because this finding has been described in only two previous case reports [72, 73]. “

  • Comparison of Quantitative MRI and CT Washout Analysis for Differentiation of Adrenal Pheochromocytoma From Adrenal Adenoma Key Points

    “In our study, no pheochromocytoma contained intracellular lipid according to previously described quantitative unenhanced CT (< 10 HU) or chemical-shift MRI (chemical-shift SI index > 16.5%, adrenal-to-spleen SI ratio < 0.71) thresholds.”

    “The presence of intracellular lipid in adrenal pheochromocytoma is extraordinarily rare. Only two case reports [14, 33] have been published to date in the histopathologic and imaging literature.”

    “Only one pheochromocytoma has been found to have unenhanced CT attenuation less than 10 HU [14], and to our knowledge, there has been no report of a pheochromocytoma exhibiting intracellular lipid on chemical-shift MR images. It can therefore be concluded that the presence of intracellular lipid in an incidental adrenal nodule is nearly diagnostic of adrenal adenoma.”

    “In lesions larger than 4 cm or in patients with a known malignancy, intracellular lipid should be interpreted more cautiously. Both adrenal cortical carcinoma and metastases (from lipid-containing primary tumors, such as renal cell carcinoma or hepatocellular cell carcinoma) must also be considered in the differential diagnosis because these lesions can mimic adenoma on the basis of quantitative imaging thresholds alone [7].”

  • Can Established CT Attenuation and Washout Criteria for Adrenal Adenoma Accurately Exclude Pheochromocytoma? Key Points

    “A substantial minority of pheochromocytomas have absolute or relative washout characteristics that overlap with those of lipid-poor adenomas.”

    “None of the pheochromocytomas had an unenhanced attenuation of 10 HU or less.”

    “Blake et al. [14] reported a series of nine adrenal nodules producing “pheochromocytoma syndrome,” in which one histologically confirmed pheochromocytoma showed both absolute washout greater than 60% and an unenhanced attenuation less than 10 HU. The authors concluded that pheochromocytoma should be included in the differential diagnosis of nodules meeting washout or attenuation criteria for adrenal adenoma. Our results agree with these findings, although none of the 38 pheochromocytomas imaged with un-enhanced CT in our series would have been confused for a lipid-rich adenoma, because none of these lesions had an unenhanced attenuation value less than or equal to 10 HU (our study minimum was 15 HU).”

  • MDCT of Adrenal Masses: Can Dual-Phase Enhancement Patterns Be Used to Differentiate Adenoma and Pheochromocytoma? Key Points

    “For indeterminate adrenal masses identified at dual-phase IV contrast-enhanced CT, higher enhancement during the arterial phase, arterial phase enhancement levels greater than 110 HU, and lesion heterogeneity should prompt consideration of pheochromocytoma.”

    “The sensitivity of 110-HU arterial enhancement for pheochromocytoma was 58%, the specificity was 100%, the positive predictive value was 100%, and the negative predictive value was 89%.”

    “No adenoma was more than 85-HU enhancing in the arterial phase, and 58% of pheochromocytomas were more than 110-HU enhancing. Most adenomas (85%) were more enhancing in the venous phase.”

    “Venous phase enhancement greater than 110 HU was identified in 7% (3/41) of adenomas.”

  • Adrenal Masses: Characterization with Combined Unenhanced and Delayed Enhanced CT
  • Pheochromocytoma: An Imaging Chameleon

GU – Renal Masses

  • Enhancement Threshold of Small (< 4 cm) Solid Renal Masses on CT Key Points

    “A minority of small RCCs do not reach either a 15- or 20-HU enhancement threshold and might be misinterpreted as a hyperattenuating cyst. Most RCCs below these enhancement thresholds are papillary RCC.”

  • Prevalence of Solid Tumors in Incidentally Detected Homogeneous Renal Masses Measuring > 20 HU on Portal Venous Phase CT Key Points

    “Our findings suggest that the most appropriate attenuation value cutoff for recommending follow-up imaging of small homogeneous renal masses may be higher than 20 HU. Although we found no solid masses in the 20- to 40-HU range, the number of lesions in the 30- to 40-HU range was smaller.”

    “We suggest that small homogeneous renal masses measuring < 30 HU require no further follow-up.”

    “Our mean lesion size was 16 mm, and more than two-thirds were either entirely surrounded by renal parenchyma or were < 50% exophytic. Thus, many of the lesions in our study were at risk of pseudoenhancement. Our findings may not apply to larger, more exophytic masses, and it is prudent to assess the risks of pseudoenhancement on a case by case basis.”

    “Small indeterminate homogeneous renal masses measuring 20–40 HU on portal venous phase CT images are highly likely to be benign cysts. Follow-up of lesions measuring < 30 HU may not be warranted.”

  • How I Do It: Evaluating Renal Masses
  • Pitfalls in Renal Mass Evaluation and How to Avoid Them
  • A Practical Approach to the Cystic Renal Mass
  • Evaluation of Bosniak category IIF complex renal cysts (Table 2)
  • Infiltrative Renal Lesions: Radiologic-Pathologic Correlation
  • Common and Uncommon Histologic Subtypes of Renal Cell Carcinoma: Imaging Spectrum with Pathologic Correlation
  • Differentiation of Subtypes of Renal Cell Carcinoma on Helical CT Scans Key Points

    “According to the First International Workshop on Renal Cell Carcinoma held by the World Health Organization, renal cell carcinoma can be classified into conventional (i.e., clear cell) renal carcinoma, papillary renal carcinoma, chromophobe renal carcinoma, collecting duct renal carcinoma, and unclassified renal carcinoma.”

    “Conventional renal carcinoma is the most common subtype, accounting for approximately 70% of renal cell carcinomas; the overall 5-year survival rate of patients with conventional renal carcinoma ranges from 55% to 60%. Papillary renal carcinoma, the second most common subtype, comprises from 15% to 20% of renal cell carcinomas and is associated with a high 5-year survival rate (80-90%).”

    “Conventional renal carcinoma showed stronger enhancement than nonconventional renal carcinomas in both the corticomedullary and excretory phases, and the tumors that enhanced more than approximately 84 H in the corticomedullary phase and 44 H in the excretory phase were likely to be conventional renal carcinoma.”

    “Chromophobe renal carcinoma…tends to exhibit homogeneous enhancement on CT. Conventional renal carcinoma…usually shows heterogeneous or predominantly peripheral enhancement on CT.”

    “A tumor that is greater than 7 cm in diameter, exhibits homogeneously weak enhancement, and has calcifications is strongly suggestive of chromophobe renal carcinoma.”

    “In addition, a tumor with heterogeneously strong enhancement and a diameter of less than 3 cm may indicate conventional renal carcinoma.”

    “Calcification was more common in papillary and chromophobe renal carcinomas than in conventional renal carcinoma.”

    “Perinephric change and venous invasion were not noted in chromophobe renal carcinoma, whereas both were common in collecting duct renal carcinoma.”

    “Hemorrhage and necrosis are predictors of poor prognosis, and calcification suggests a higher 5-year survival rate. Hemorrhage and necrosis (heterogeneous or predominantly peripheral enhancement pattern) were more common in conventional and collecting duct renal carcinomas, both of which are associated with a poor prognosis. Calcification was more frequently seen in papillary and chromophobe renal carcinomas, which are associated with a better prognosis.”

    “A patient with a subtype of renal cell carcinoma that tends to not metastasize, such as chromophobe renal carcinoma, may not need to undergo a complex metastasis survey. An unnecessarily wide resection may be avoided in patients with a subtype that is unlikely to recur or metastasize, thereby reducing postoperative morbidity and mortality.”

  • Delayed CT to Evaluate Renal Masses Incidentally Discovered at Contrast-enhanced CT: Demonstration of Vascularity with Deenhancement Key Points

    “Delayed CT of incidentally discovered well-demarcated homogeneous high-attenuating (>30-HU) renal masses detected at postcontrast CT enables differentiation of high-density cysts from renal neoplasms by demonstrating deenhancement as a proof of vascularity and, hence, neoplasm.”

    “In the masses that demonstrated deenhancement, the mean difference in attenuation values between the initial postcontrast and delayed CT studies was 32.3 HU (range, 15–67 HU).”

    “There is no absolute number of Hounsfield units that can be used to signify enhancement or deenhancement. What is needed is an understanding of the possible pitfalls involved in these measurements so that the necessary adjustments can be made. Whatever the value of tissue enhancement or deenhancement used, it must be stressed that enhancement or deenhancement must be unequivocal to be used in the diagnosis.”

  • Imaging of Renal Lymphoma: Patterns of Disease with Pathologic Correlation

GU – Collecting Systems, Ureters & Bladder

GU – Scrotum

  • Testicular Microlithiasis: What Should You Recommend? Key Points

    “Our own recommendation for a possible dictation template is as follows: Testicular microlithiasis is present without intratesticular mass or other worrisome findings. In the absence of any other risk factors for testicular cancer (e.g., personal history of testicular cancer, a father or brother with testicular cancer, history of cryptorchidism or maldescent, testicular atrophy, or other risk factors), no further imaging or biochemical follow-up is necessary; all that is recommended is routine monthly testicular self-examination. However, if the patient has risk factors for testicular cancer, referral to a urologist for evaluation and determination of an optimal follow-up strategy is recommended.”

  • Testicular Torsion with Preserved Flow: Key Sonographic Features and Value-added Approach to Diagnosis Key Points

    “In a study in which all children with symptoms of acute scrotum underwent surgical revision, torsion of the appendix testis was the most common pathology (57%), followed by torsion of the spermatic cord (27%) and much less commonly epididymitis.”

    “Complete torsion occurs when the testis twists 360° or greater, usually leading to absence of intratesticular flow on color Doppler exam; however sometimes the flow is preserved or decreased. Intermittent torsion is defined as sudden onset of unilateral testicular pain of short duration with spontaneous resolution. In partial or incomplete torsion, the degree of spermatic cord twist is less than 360°, allowing for some residual perfusion to the testis. However there is no spontaneous resolution of pain.”

    “Sonographic features most reliable for diagnosing testicular torsion: Spermatic cord whirlpool sign, redundant spermatic cord, and horizontal or altered testicular lie.”

    “The “whirlpool sign” is defined as an abrupt change in the course of the spermatic cord with a spiral twist at the external inguinal ring or in the scrotal sac. It is a reliable and direct sonographic sign that implies torsion of the spermatic cord and testis. The classic whirlpool sign is observed less frequently compared to a tortuous redundant cord but is considered to be of great diagnostic significance.”

    “Redundant spermatic cord can be described as the presence of excess and tortuous spermatic cord in the scrotal sac and is a very helpful sign of anomalous attachment of the tunica vaginalis. Normally, there should be no free piece of cord in the scrotal sac. The bunched up cord often looks like an extratesticular, ovoid heterogeneous-echotexture mass that has been described as “boggy pseudomass,” typically seen below the point of torsion. The exact point of twisting of the cord is frequently indiscernible and hence the term “torsion knot” might be used interchangeably with boggy pseudomass, both implying a tangle of varying proportions of convolutions of the swollen spermatic cord with or without the epididymis.”

    “Normally the testes lie in a vertical orientation. A horizontal lie is thought to result from abnormal attachments of the tunica vaginalis, namely the bell clapper anomaly. Horizontal or altered/oblique lie has been known to be associated with intermittent torsion.”

    “Swollen epididymis and testis with testicular flow that is only minimally decreased, normal, or increased in boys with incomplete or intermittent testicular torsion can mimic epididymo-orchitis. The most common cause of acute scrotal pain in children is torsion of appendix testis, which can also mimic epididymo-orchitis. Therefore it is important to evaluate for the presence of avascular nodule that might represent the torsed appendage.”

    “Likelihood of salvage of the testis is directly related to the time between symptom onset and detorsion. However in our experience salvage is unpredictable depending on how tightly or loosely the cord was twisted, and hence surgery should not be delayed after the diagnosis of torsion is established, even if the time to presentation exceeds the 6- to 10-h window. A testis might become nonviable as early as 4 h after a 720° twist, or it might remain viable for several days if the torsion is incomplete. In one of our cases, salvage was achieved after 3 weeks from initial diagnosis of epididymitis to final diagnosis of incomplete torsion.”

    “The presence of redundant spermatic cord within the scrotum is highly suspicious for testicular torsion. An enlarged epididymal-cord complex representing the torsion knot/pseudomass is more frequently identified at the sonographic examination compared to the more classic whirlpool sign of twisted spermatic cord. Residual flow might be preserved in parts of the cord when the twist is not tight enough to completely obliterate the flow. An astute analysis of the cord and lie of the testis can prevent the overdiagnosis of epididymitis.”

GU – Prostate

  • Radiologist, Be Aware: Ten Pitfalls That Confound the Interpretation of Multiparametric Prostate MRI Key Points

    Central Zone: Central zone appears as a symmetric band of tissue between the peripheral and transition zones at the base of the prostate, extending from below the seminal vesicles to the verumontanum and surrounding the ejaculatory ducts. Central zone exhibits decreased T2 signal intensity and decreased ADC relative to the peripheral zone. Depending on the level of the axial slice, the two lobes of the central zone may exhibit a dumbbell-shaped appearance rather than appear as a single confluent structure. On coronal images, the central zone will have a triangular or tear-drop-shaped appearance.”

    Thickening of Surgical Capsule: A ‘surgical’ capsule surrounding the transition zone has also been described. On MRI, the surgical capsule appears as a thin crescentic band of decreased T2 signal intensity surrounding the transition zone. In addition, as with the central zone, the surgical capsule exhibits decreased ADC. When encountered on the ADC map, its location and bandlike or crescentic shape can serve as clues to its cause.”

    Periprostatic Venous Plexus: The normal prostatic veins form a periprostatic venous plexus that courses around the lateral margins of the prostate before communicating with a venous plexus anterior to the prostate and ultimately draining into the internal iliac veins. This plexus forms a site of potential spread of tumor and also has been reported to exhibit a congested appearance in the setting of prostatitis. In addition, Phillips et al. reported in a study using older MRI technology that in some instances it was difficult to separate the periprostatic venous plexus from the normal peripheral zone.”

    Neurovascular Bundle: The NVB has classically been viewed as a discrete structure coursing along the posterolateral margin of the prostate near the prostate capsule at approximately the 5- and 7-o’clock positions and covered by the lateral pelvic fascia. More recent anatomic studies based on surgical specimens from non-nerve-sparing prostatectomy procedures have challenged the historical view of the anatomy of the NVB and show that in approximately half of cases there is no discrete bundle formation and that the nerve trunks are sparsely distributed along both the anterior and posterior lateral aspects of the prostate.”

    “The proximity of both the periprostatic venous plexus and NVB to the peripheral zone may create a clinical challenge in assessing for focal peripheral zone lesions. In addition, these structures exhibit decreased T2 signal intensity and a signal void on the ADC map. Generally, the T2-weighted images, given their higher in-plane spatial resolution, are helpful to show that a potential lesion identified on DWI or DCE-MRI represents the normal periprostatic venous plexus or NVB.”

    Postbiopsy Hemorrhage: Hemorrhage may cause decreased T2 signal intensity that can mimic or obscure an area of tumor. The impact of postbiopsy hemorrhage may be most pronounced on T2-weighted imaging, with relatively milder changes encountered on DWI and DCE-MRI. In our experience, a discrete masslike abnormality that shows more marked signal intensity alterations on DWI and DCE-MRI than are observed within the remainder of the peripheral zone should be deemed suspicious for tumor despite the presence of postbiopsy hemorrhage. In addition, extensive postbiopsy hemorrhage has been observed to spare and thus outline the margins of dominant tumors; this “MRI exclusion sign” can be used to potentially take advantage of the distribution of the hemorrhage as a tool to aid tumor localization.”

    Stromal Benign Prostatic Hyperplasia Nodule: 30% of prostate cancers arise from the transition zone. Although glandular BPH exhibits T2 hyperintensity owing to its fluid content and is thus readily distinguished from transition zone tumors, stromal BPH exhibits T2 hypointensity and poses a greater diagnostic dilemma. Stromal BPH nodules are generally rounded or spherical in shape, with discrete margins. On the other hand, a transition zone tumor is suggested in the presence of irregular margins; a lenticular, teardrop, or other unusual shape; and invasive behavior, such as extension into the anterior fibromuscular stroma or adjacent portion of the peripheral zone.”

    Acute and Chronic Prostatitis and Postinflammatory Scars and Atrophy: Within the peripheral zone, a broad spectrum of inflammatory and infectious processes, including acute and chronic prostatitis as well as postinflammatory scars and atrophy, may mimic the presence of tumor. These processes have been reported to cause signal abnormalities on T2-weighted imaging, DWI, DCE-MRI, and MR spectroscopy.”

    “A lesion with a more well-defined and nodular appearance should be considered of greater suspicion for tumor. On the other hand, inflammatory lesions are generally less mass-like in morphology, exhibiting margins that are ill defined or linear rather than rounded in appearance.”

    Granulomatous Prostatitis: This uncommon benign inflammatory condition often presents with a firm nodule on digital rectal examination and elevated prostate-specific antigen, thus clinically mimicking prostate cancer. Although possible causes include previous intravesical bacille Calmette-Guérin (BCG) therapy for bladder cancer, tuberculous prostatitis, and previous intervention such as transurethral resection of the prostate, most cases are idiopathic without a specific cause identified. On MRI, granulomatous prostatitis may appear as a discrete mass with markedly abnormal T2 signal intensity and ADC, more pronounced than observed for other inflammatory or infectious processes and thus be deemed of very high suspicion for tumor. Furthermore, there may be associated infiltration of the periprostatic fat by inflammation, thus mimicking extraprostatic tumor extension.”

    Anatomic Distortion of High-b-Value Diffusion-Weighted Images: Additional steps particularly focusing on the impact of rectal gas are warranted. For instance, although anterior-to-posterior phase encoding is most commonly used in abdominal and pelvis MRI given the generally narrower size of the torso in this direction, left-to-right phase encoding may be preferable for routine DWI of the prostate to avoid the propagation of artifacts resulting from rectal gas or stool across the prostate.”

    Lack of Suppression of Benign Prostate Tissue on Standard High-b-Value Diffusion-Weighted Images: Standard DWI protocols for a broad spectrum of organs use a maximal b value in the range of 500– 1000 s/mm2. However, in the prostate, the benign parenchyma continues to exhibit mild hyperintensity at b values in this range. Thus, some focal lesions will be inconspicuous compared with the background prostate parenchyma.”

    “Studies have shown greater tumor conspicuity and detection on the ADC map than on the native-acquired DWI, and it is recommended that this image set be reviewed in detail as the primary image set used when performing DWI of the prostate. Expert-panel consensus guidelines prescribe greater weight to findings identified on the ADC map than on the high-b-value images.”

    Suboptimal Windowing of the ADC Map: It is important to recognize that the default window and level of the ADC map generated by the MRI console or PACS system may not be optimal for lesion detection. In particular, if the level is too high, the hypointensity of focal lesions may not be qualitatively appreciated on visual evaluation.”